Country Wise Differences In Average Annual Spending On Hair & Beauty vs Health
| By Country | |||
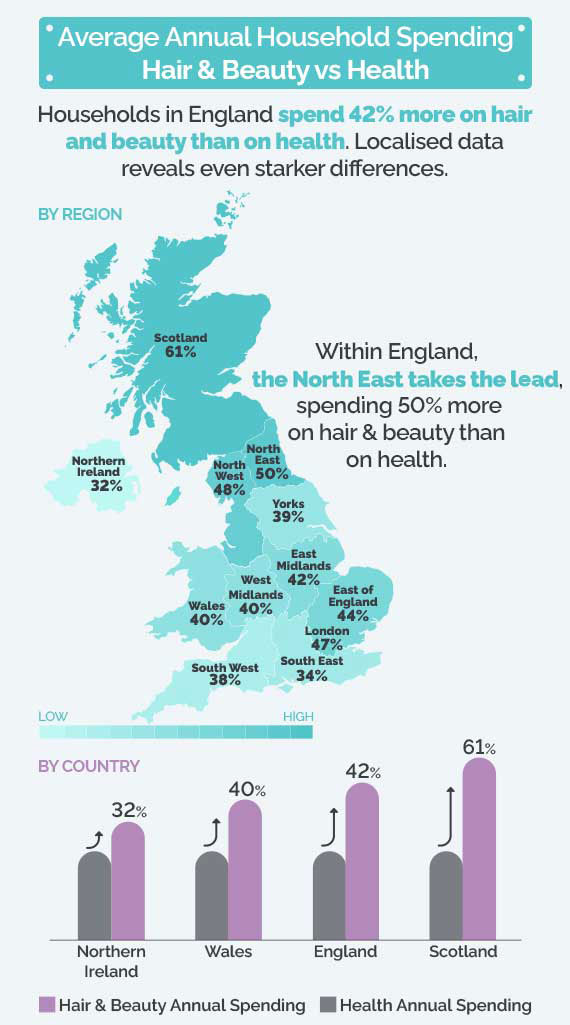
| Scotland | £733.20 | £286.00 | 61% |
| England | £748.80 | £431.60 | 42% |
| Wales | £520.00 | £317.20 | 39% |
| Northern Ireland | £702.00 | £478.40 | 32% |
Upon reviewing how each country of the UK fared, Longevita Hair Transplant discovered that Scotland overall had the most significant spending difference of 61% between hair & beauty vs. health.
Wales took the third spot, although it had the lowest spending on hair and beauty of all the other countries.
Northern Ireland came in last, having the third-highest hair and beauty-related expenditure, but it also had the highest health expenditure of £478.40.
Regional Differences In Average Annual Spending On Hair & Beauty vs Health
| By Region | |||
| Areas | Hair & Beauty | Health | Difference in Percentage |
| North East | £556.40 | £275.60 | 50% |
| North West | £676.00 | £353.60 | 48% |
| London | £811.20 | £431.60 | 47% |
| East of England | £686.40 | £384.80 | 44% |
| East Midlands | £738.40 | £431.60 | 42% |
| West Midlands | £826.80 | £499.20 | 40% |
| Yorkshire and The Humber | £670.80 | £410.80 | 39% |
| South West | £702.00 | £436.80 | 38% |
| South East | £858.00 | £566.80 | 34% |
Within England, the North East takes the lead, spending 50% more on hair & beauty than on health.
The North West was a close second, lagging by two percentage points, even though households spent £119.6 more on hair and beauty compared to the North East. However, it was offset by the £78 more spent on health.
London took the third place having spending difference of 47% between hair and beauty vs. health.
The West Midlands had the second-highest hair and beauty-related expenditures of £826.80, while the spending on health stood at £499.20, a significant difference of 40%.
Households in the South East were the biggest hair and beauty spenders. However, expenses on health were notable at £566.80, meaning overall they experienced a spending difference of 34%; the lowest of all regions.
Methodology
- Longevita Hair Transplant reviewed data from the Office for National Statistics (ONS)’s UK’s family spending workbook 2022 edition to calculate hair and beauty spending across different regions and countries of the UK. The data is accurate for the year ending 2020 to year ending 2022, and is an average.
- Hair and beauty categories included: hairdressing, beauty treatments, hair products, cosmetics, personal electrical appliances, toiletries, soap, accessories and personal effects
- Health categories included: Medicines, prescriptions, healthcare products and equipment, spectacles, lenses, accessories and repairs and hospital services.
- For each category, the total per week expenditure was multiplied by 52 (weeks in a year) to determine the average annual expenditure.
- The percentage difference was then calculated based on average annual data for all areas and ranked accordingly.